The images are simple connected graphs that represent digits from 0 to 9 in the 24-hour time. Here they are in order:
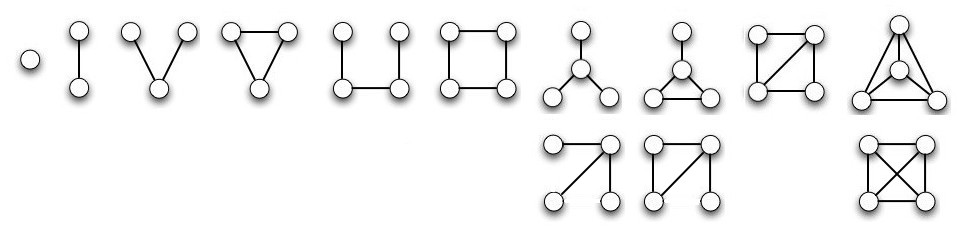
You might get a better idea of the rationale for ordering them this way by looking at the equivalent graphs in the lower row. I could have drawn them this way, but I chose the upper renderings. The upper and lower versions are the same graph!
There is an easily found property of the graph that can be ordered and is monotonically increasing from digit to digit; moreover there do not exist any graphs with intermediate values — that is, we didn’t “skip” any. Namely, the vertex sequences, e.g. ( (0), (1,1), (2,1,1), ...).
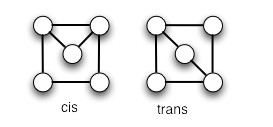
Alas, the convenenient ordering of vertex sequences breaks down eventually, so we can not use a single graph to represent the minute or second count from 0 to 60. (That is, we can’t use base 60, so we bail out and use base 10. But it is nice that the complete graph K4 represents 9.) At the 37th step, there are two graphs with the same vertex sequence of (3,3,2,2,2):
Interestingly, as we enumerate the connected graphs, they are all planar until we get to the last one of degree five, which is K5, with degree sequence (4,4,4,4,4).
You can see how I developed this sequence by checking out the 23 February 2011 entry of my notebook page.